In this lesson, we will dive deeper into the practical applications of spectroscopy and see how astronomers use these principles to unravel the mysteries of the cosmos. From identifying elements in stars to measuring the velocities of distant galaxies, spectroscopy provides an incredible window into the universe.
Video
Watch this video for a detailed explanation of the Doppler effect and its significance in astronomy.
Identifying Elements in Stars
Spectral Lines as Cosmic Fingerprints
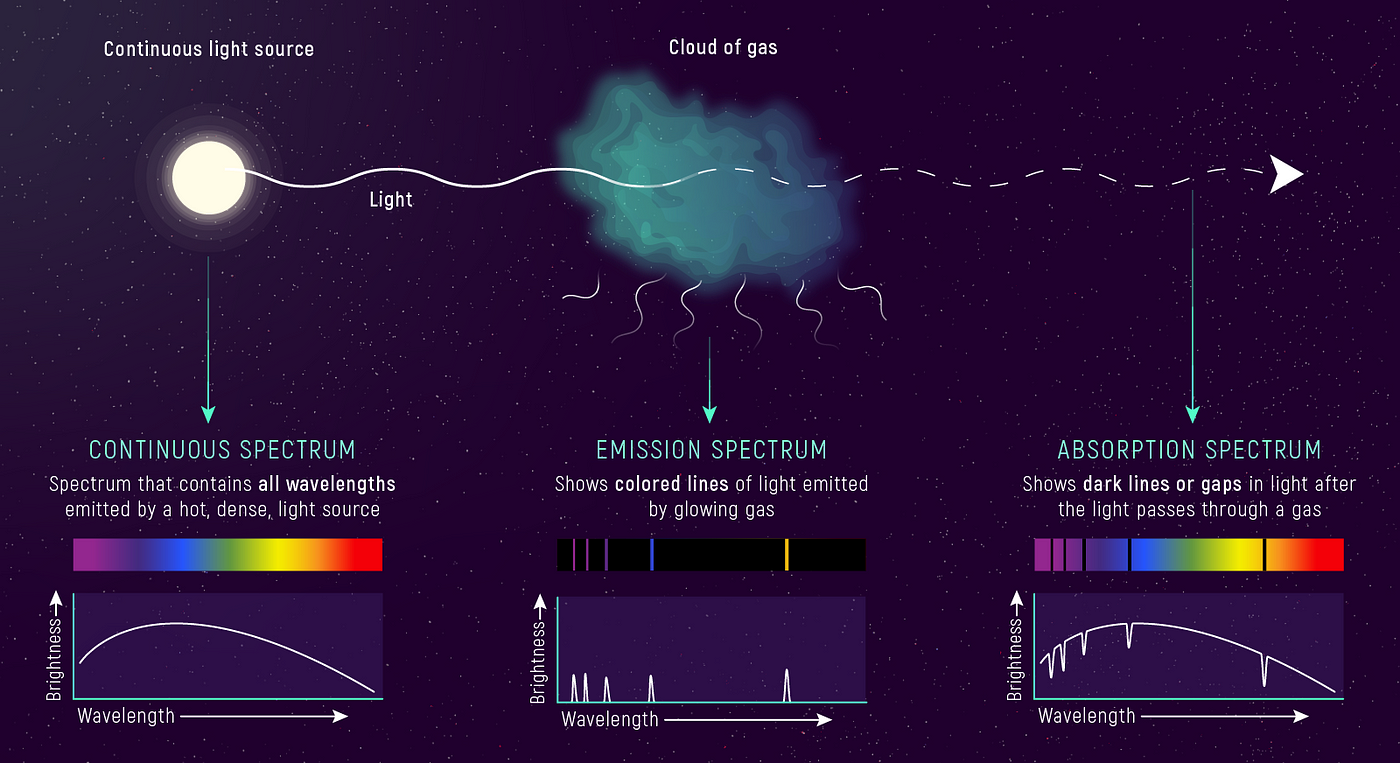
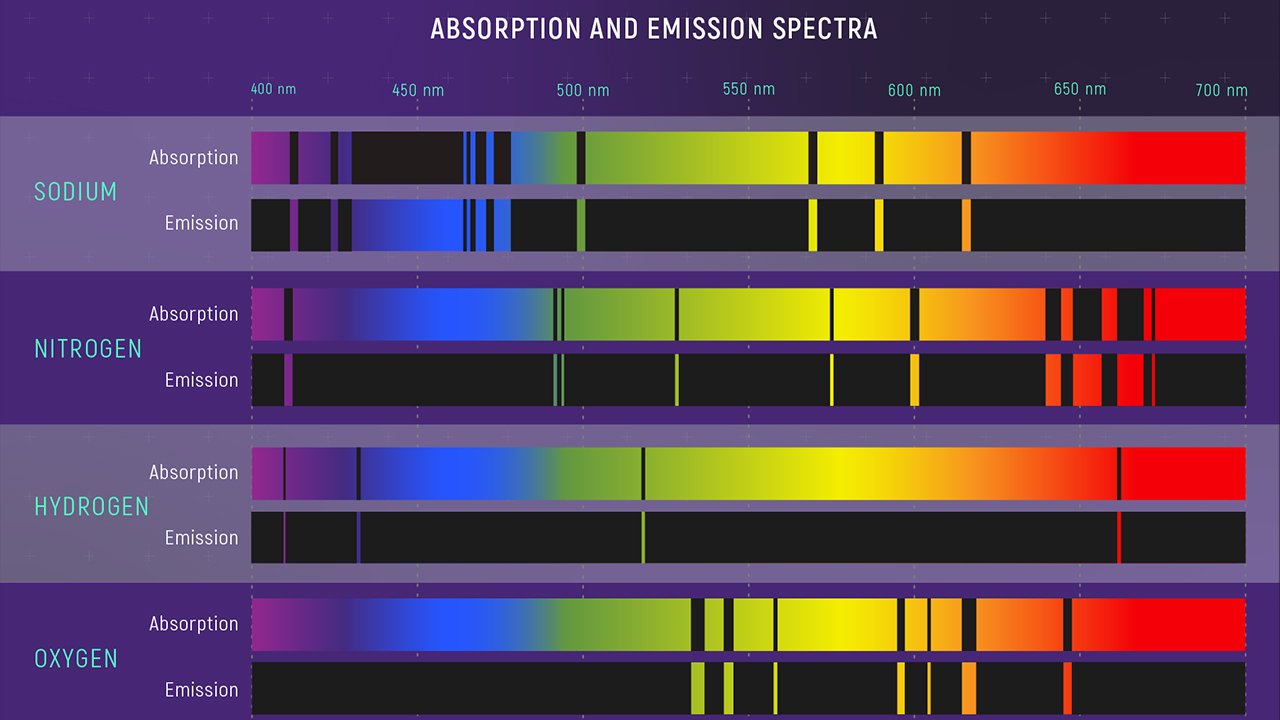
Every element in the universe has a unique set of spectral lines, much like fingerprints. These lines are created by the transitions of electrons between energy levels in atoms. When light from a star passes through its atmosphere, certain wavelengths are absorbed by the atoms in the atmosphere. This absorption produces dark lines in the star’s spectrum, known as absorption lines. These lines allow us to determine the elements present in the star, as each element absorbs light at specific wavelengths.
Element Identification
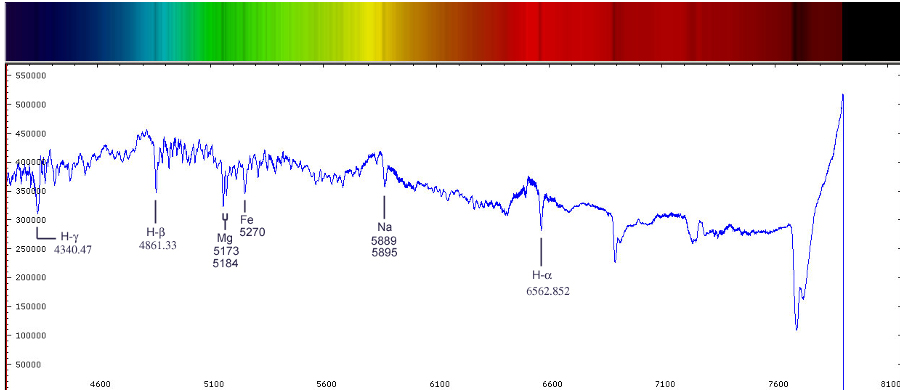
Astronomers use spectroscopy to identify the chemical composition of stars by comparing observed spectral lines to known atomic spectra. For example, the Balmer series of hydrogen, which produces lines in the visible part of the spectrum, is often seen in stellar spectra. The positions of these lines can be matched with laboratory data to confirm the presence of hydrogen.
Other elements like helium, calcium, sodium, and iron also have characteristic spectral lines. By analyzing these lines, astronomers can determine not only the presence of elements but also their relative abundance. This information is crucial in understanding the life cycles of stars, as stars of different ages and masses show varying compositions.
Application in Stellar Spectra
For example, if a star’s spectrum shows strong hydrogen lines, it suggests that hydrogen is abundant in the star’s atmosphere, which is typical for young stars. On the other hand, older stars or stars near the end of their life may show strong lines of heavier elements like carbon or iron, indicating that nuclear fusion has progressed to the production of heavier elements.
To give you a practical understanding, here are some common spectral lines astronomers look for:
- Hydrogen (H-alpha line): Found at 656.3 nm, a prominent red line in the spectra of many stars.
- Helium (He I and He II lines): Visible in the spectra of young, hot stars.
- Calcium (Ca II H and K lines): Common in the spectra of cooler stars.
Each of these lines provides clues about the temperature, composition, and age of a star.
Measuring Stellar Velocities Using Doppler Shifts
The Doppler Effect in Astronomy
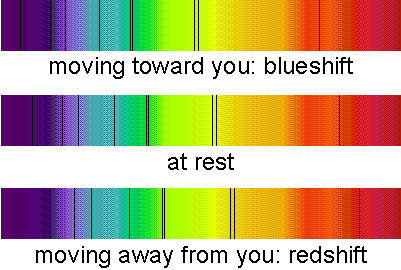
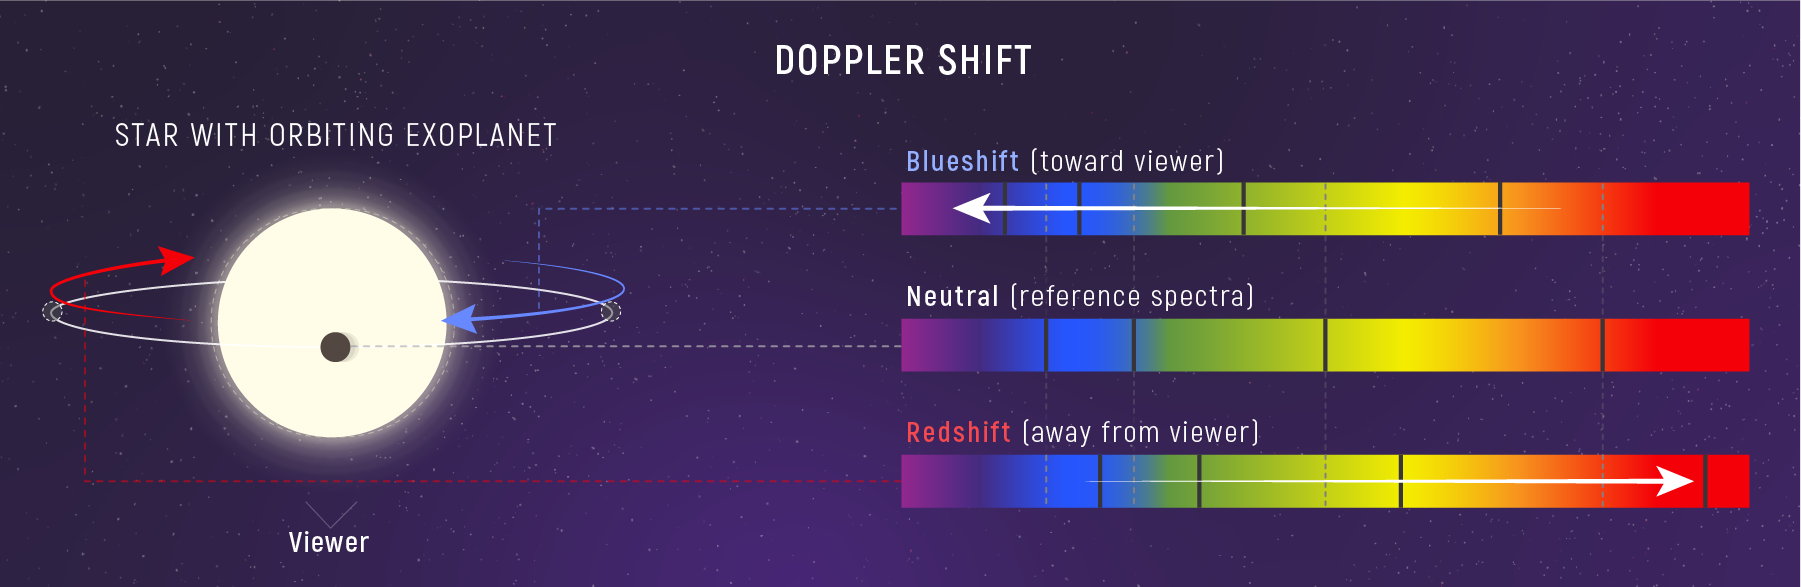
The Doppler effect is a phenomenon where the wavelength of light changes depending on the relative motion between the source of the light and the observer. In astronomy, this is used to measure the radial velocity of stars and galaxies—whether they are moving toward or away from us.

When a star or galaxy moves toward us, the wavelengths of light are compressed, causing the spectral lines to shift toward the blue end of the spectrum, known as blueshift. Conversely, when the object is moving away from us, the wavelengths are stretched, shifting the lines toward the red end of the spectrum, known as redshift.
Radial Velocity Measurements
By measuring the shift in the position of spectral lines, astronomers can calculate the velocity of a star or galaxy along the line of sight, known as the radial velocity. The larger the shift, the faster the object is moving. This technique is invaluable for studying the motion of stars within galaxies, the expansion of the universe, and the motion of galaxies relative to one another.
The Doppler formula used to calculate the radial velocity is:
\[v = \frac{\lambda - \lambda_0}{\lambda_0} \cdot c\]
Where:
- $\lambda$ is the observed wavelength,
- $\lambda_0$ is the rest wavelength (the original wavelength when the object is not moving relative to the observer),
- $v$ is the velocity of the object (positive for receding, negative for approaching),
- $c$ is the speed of light, $3.00 \times 10^8 \, \text{m/s}$.
If $v$ is positive, the object is moving away from us (redshift). If $v$ is negative, the object is moving toward us (blueshift).
Example: Calculating the Radial Velocity of a Star
Problem: A spectral line that is normally observed at 500 nm appears at 502 nm in the spectrum of a distant star. Calculate the star’s radial velocity and determine whether it is moving toward or away from us.
Solution: The observed wavelength $\lambda = 502 \, \text{nm}$ and the rest wavelength $\lambda_0 = 500 \, \text{nm}$. Using the Doppler formula:
\[v = \frac{\lambda - \lambda_0}{\lambda_0} \cdot c = \frac{502 \, \text{nm} - 500 \, \text{nm}}{500 \, \text{nm}} \cdot 3.00 \times 10^8 \, \text{m/s}\] \[v = \frac{2}{500} \cdot 3.00 \times 10^8 \, \text{m/s}\] \[v = 1.2 \times 10^6 \, \text{m/s}\]Since $v$ is positive, the star is moving away from us at a velocity of $1.2 \times 10^6 \, \text{m/s}$ (redshift).
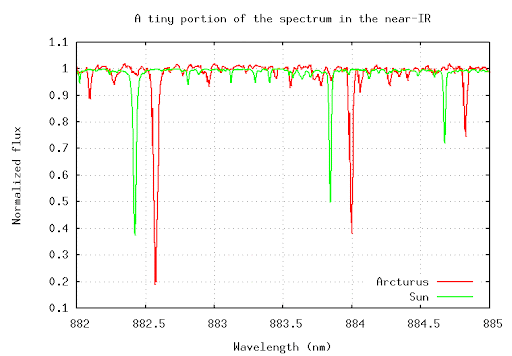
In the image below, we can compare the spectrum of Arcturus to that of the Sun. Notice how the absorption lines in the spectrum of Arcturus appear shifted compared to those in the solar spectrum. This shift indicates that Arcturus is moving relative to the Earth.
By measuring the displacement of these absorption lines, astronomers can determine Arcturus’s radial velocity. In this case, if the lines are shifted toward the red end of the spectrum, it means that Arcturus is moving away from us (redshift). If they were shifted toward the blue end, Arcturus would be moving toward us (blueshift).
This comparison of the spectral lines provides a powerful tool for understanding the motion of stars and the dynamics of stellar systems.
Exoplanet Detection Using Radial Velocity
One of the most exciting applications of the Doppler effect is in the detection of exoplanets—planets that orbit stars other than the Sun. As a planet orbits a star, the gravitational pull of the planet causes the star to “wobble.” This wobble causes tiny shifts in the star’s spectral lines as the star moves toward and away from us. By measuring these shifts, astronomers can infer the presence of planets, even if they are too faint to be observed directly.
The radial velocity method has been one of the most successful techniques in detecting exoplanets, providing evidence of planets in orbit around stars far beyond our solar system.
Spectral Line Catalogs and Practical Spectroscopy
Line Lists and Databases
Spectral lines are the foundation of spectroscopic analysis, but they are only useful if we can identify them correctly. For this, astronomers rely on line lists and catalogs, which are databases of spectral lines corresponding to different elements and ions. One well-known resource is the NIST Atomic Spectra Database, which provides detailed information about the wavelengths of spectral lines, their strengths, and the conditions under which they occur.
When astronomers observe a spectrum from a star or galaxy, they compare the observed spectral lines to these databases to identify the elements present. This process involves:
- Matching the wavelength of the observed lines to the database.
- Checking the intensity and pattern of the lines to confirm the element.
- Determining if any Doppler shift has occurred due to the star’s motion.
Real-World Analysis
In practical spectroscopy, astronomers use a variety of telescopes equipped with spectrometers to capture light from distant stars, galaxies, and nebulae. These instruments spread the light into its component wavelengths, producing a spectrum. The data is then processed using software that compares the observed spectral lines with known line lists to identify the elements and infer conditions such as temperature, density, and velocity.
Spectroscopy is performed at both ground-based observatories, like the Keck Observatory in Hawaii, and space-based telescopes, such as the Hubble Space Telescope. Space telescopes are particularly useful for observing in the ultraviolet and infrared parts of the spectrum, which are absorbed by Earth’s atmosphere.
Check Your Understanding
-
Spectral Lines and Element Identification: Describe how astronomers use spectral lines to identify the elements present in a star’s atmosphere. Why is each element associated with a unique set of spectral lines?
-
Doppler Effect: Explain the Doppler effect and how it helps astronomers measure the velocity of a star. How would you differentiate between a star moving toward us and one moving away?
-
Radial Velocity Measurement: A star’s spectrum shows a hydrogen line that is normally observed at 656.3 nm but appears at 657.1 nm. Calculate the radial velocity of the star. Is the star moving toward or away from us? (Use the speed of light, $c = 3.00 \times 10^8 \, \text{m/s}$)
-
Exoplanet Detection: How does the radial velocity method work in detecting exoplanets? Why does a star “wobble” due to an orbiting planet?
-
Doppler Shift Formula: A spectral line from a distant galaxy appears at 400.5 nm, while its rest wavelength is 399.0 nm. Calculate the galaxy’s velocity relative to Earth using the Doppler shift formula. Is the galaxy moving toward or away from us?
-
Velocity of Stars in a Galaxy: How can measuring the radial velocities of stars within a galaxy help astronomers understand the structure and rotation of the galaxy? Provide an example of what might be observed.
-
Spectral Line Catalogs: Why are spectral line catalogs and databases essential for spectroscopic analysis? How do astronomers use these tools to match observed spectral lines with known elements?
-
Wavelength and Frequency Relationship: A star emits a spectral line with a frequency of $5.00 \times 10^{14} \, \text{Hz}$. Calculate the wavelength of this line in nanometers. (Use the speed of light, $c = 3.00 \times 10^8 \, \text{m/s}$)
-
Doppler Effect and Expanding Universe: How does the Doppler effect provide evidence for the expanding universe? Explain how observations of redshifted galaxies support the Big Bang theory. (This one might require some research).
-
Stellar Composition Over Time: Stars of different ages often show different spectral lines. Why do older stars exhibit strong lines of heavier elements like carbon and iron, while younger stars show more hydrogen and helium lines?
Resources
- Astronomy (2016). Andrew Fraknoi, David Morrison, and Sidney C. Wolff.
- NIST Atomic Spectra Database