In this lesson, we will explore the different types of spectra—continuous, emission, and absorption—and how they reveal vital information about celestial objects. Spectroscopy is one of the most powerful tools in astronomy, allowing us to decode the physical conditions, chemical composition, and motions of stars, planets, and galaxies. By connecting this to previous lessons on blackbody radiation, atomic structure, and energy transitions, we’ll see how light interacts with matter to produce unique patterns of spectral lines.
Video
Watch this video for a general discussion on the importance of spectroscopy in astronomy.
Types of Spectra
In previous lessons, we explored the nature of light, blackbody radiation, and atomic energy levels. These concepts help explain the three main types of spectra that light can produce: continuous, emission, and absorption. Understanding these spectra is key to learning how light interacts with matter in the universe.
What is a Spectrum?
A spectrum is the range of different colors or wavelengths of light that an object emits, absorbs, or reflects. When light is passed through a prism, it spreads out into a rainbow of colors. Each part of the rainbow corresponds to a different wavelength of light, and by analyzing how much light is present at different wavelengths, astronomers can learn a lot about the objects that produced the light, such as stars or galaxies.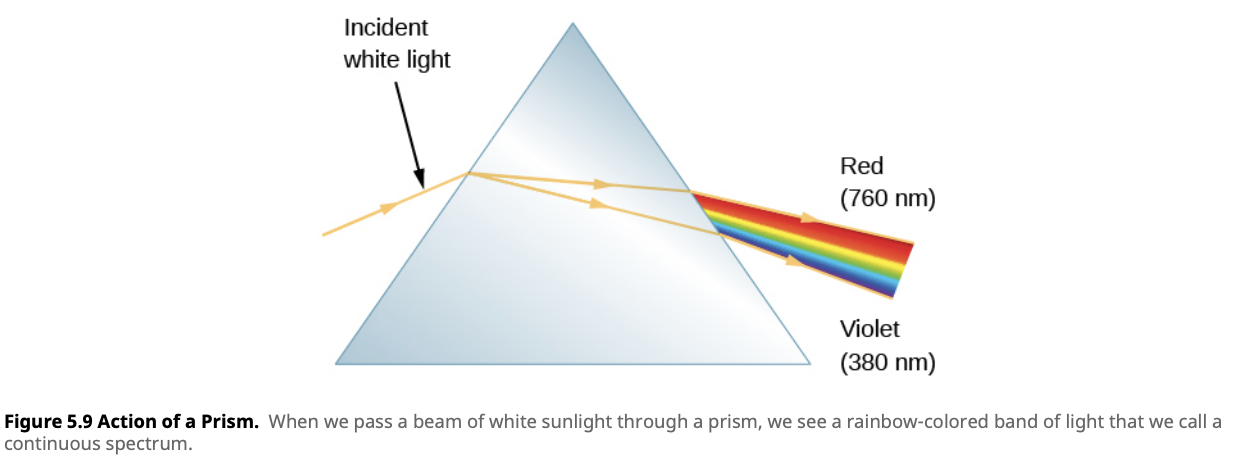
Continuous Spectrum
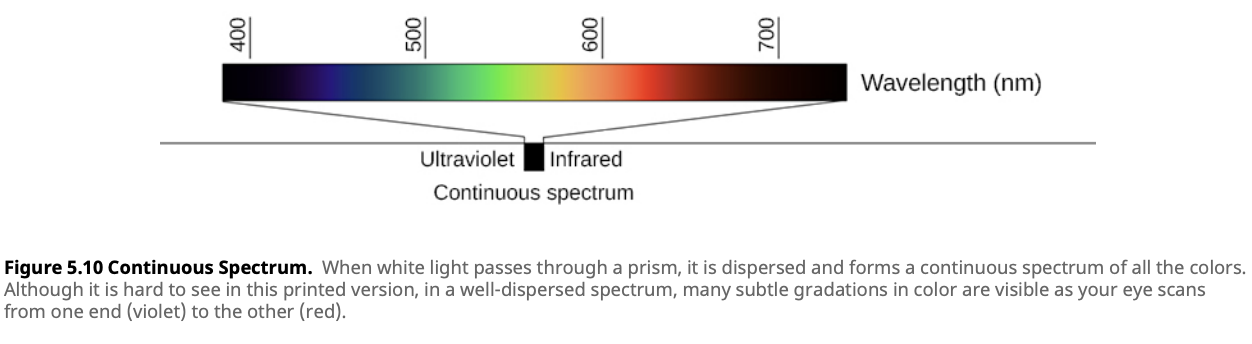
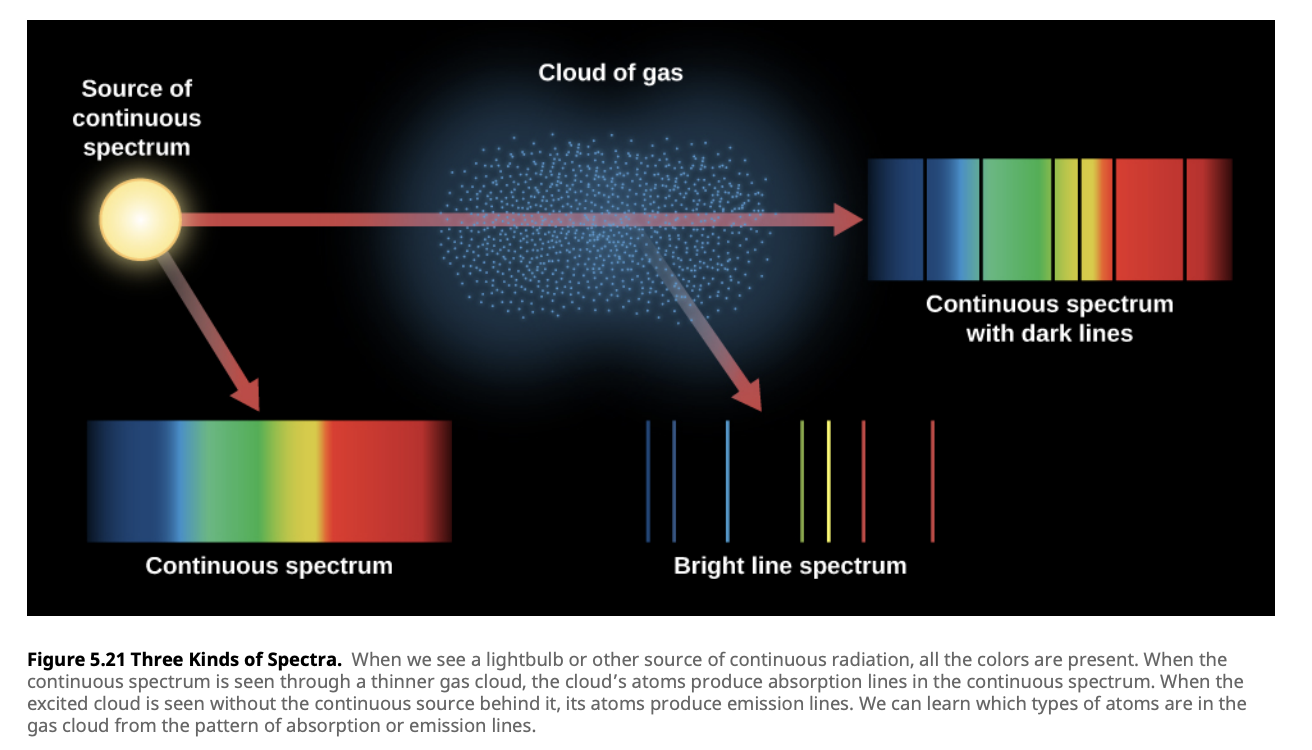
A continuous spectrum is when there is some amount of light present at all possible wavelengths (or colors), without any gaps. This type of spectrum is produced by hot, dense objects, such as the core of a star or a filament in a light bulb. When you look at a continuous spectrum, you see a complete rainbow of colors, blending from one to the next without interruption.
For example, in Lesson 4.2, we learned about blackbody radiation. Any object that has a temperature emits thermal radiation. The spectrum of this radiation is continuous, meaning it contains all wavelengths of light, and the exact shape of the spectrum depends on the object’s temperature. Stars, for instance, emit continuous spectra because their hot, dense interiors act like blackbodies.
A continuous spectrum is produced by moving charged particles, like electrons, in a dense environment. For example, in stars, the high-density plasma in the core scatters photons (light particles), spreading the light across all wavelengths. This creates a continuous range of colors with no missing parts.
The Stefan-Boltzmann Law explains how much energy a star emits based on its temperature. This law tells us that hotter stars shine more brightly and emit more energy across all wavelengths:
\[F = \sigma T^4\]
Where:
- $F$ is the total energy emitted per unit area of the star’s surface (in watts per square meter),
- $\sigma$ is the Stefan-Boltzmann constant, which is $5.67 \times 10^{-8} \, \text{W/m}^2 \cdot \text{K}^4$,
- $T$ is the temperature of the star in kelvins (K).
The Wien’s Displacement Law helps us understand why hotter objects look bluer and cooler objects look redder. It shows that the peak wavelength of the light emitted by an object shifts depending on its temperature. Hotter objects emit more light at shorter (bluer) wavelengths, while cooler objects emit more light at longer (redder) wavelengths:
\[\lambda_{\text{max}} = \frac{b}{T}\]
Where:
- $\lambda_{\text{max}}$ is the peak wavelength of the emitted radiation (in meters),
- $b$ is Wien’s displacement constant, which is $2.898 \times 10^{-3} \, \text{m} \cdot \text{K}$,
- $T$ is the temperature of the object in kelvins (K).
This is why the color of a star can tell us a lot about its temperature!
Emission Spectrum
An emission spectrum shows bright lines at specific wavelengths against a dark background. This occurs when a hot, low-density gas emits light as its electrons transition between energy levels. Each element has unique energy levels, so the emitted light forms a specific set of bright lines, creating a “spectral fingerprint.”
When an electron in an atom gains energy, it moves to a higher energy level. As it falls back to a lower level, it releases energy as a photon. The energy of this photon corresponds to the difference between the two levels:
\[\Delta E = h \cdot f\]
where:
- $\Delta E$ is the energy difference between the levels,
- $h$ is Planck’s constant,
- $f$ is the frequency of the emitted photon.
The wavelength of the photon is related to its frequency by:
\[c = \lambda \cdot f\]
where $c$ is the speed of light and $\lambda$ is the wavelength.
For example, in the hydrogen atom, when an electron falls from the $n = 3$ to the $n = 2$ level, it emits red light with a wavelength of 656 nm, known as the H-alpha line. This emission line helps astronomers identify hydrogen in stars and galaxies. Other transitions, such as from $n = 4$ to $n = 2$, produce different colors.
Emission spectra are commonly observed in emission nebulae like the Orion Nebula, where the hot gas emits bright lines at specific wavelengths, revealing the chemical composition of the gas.
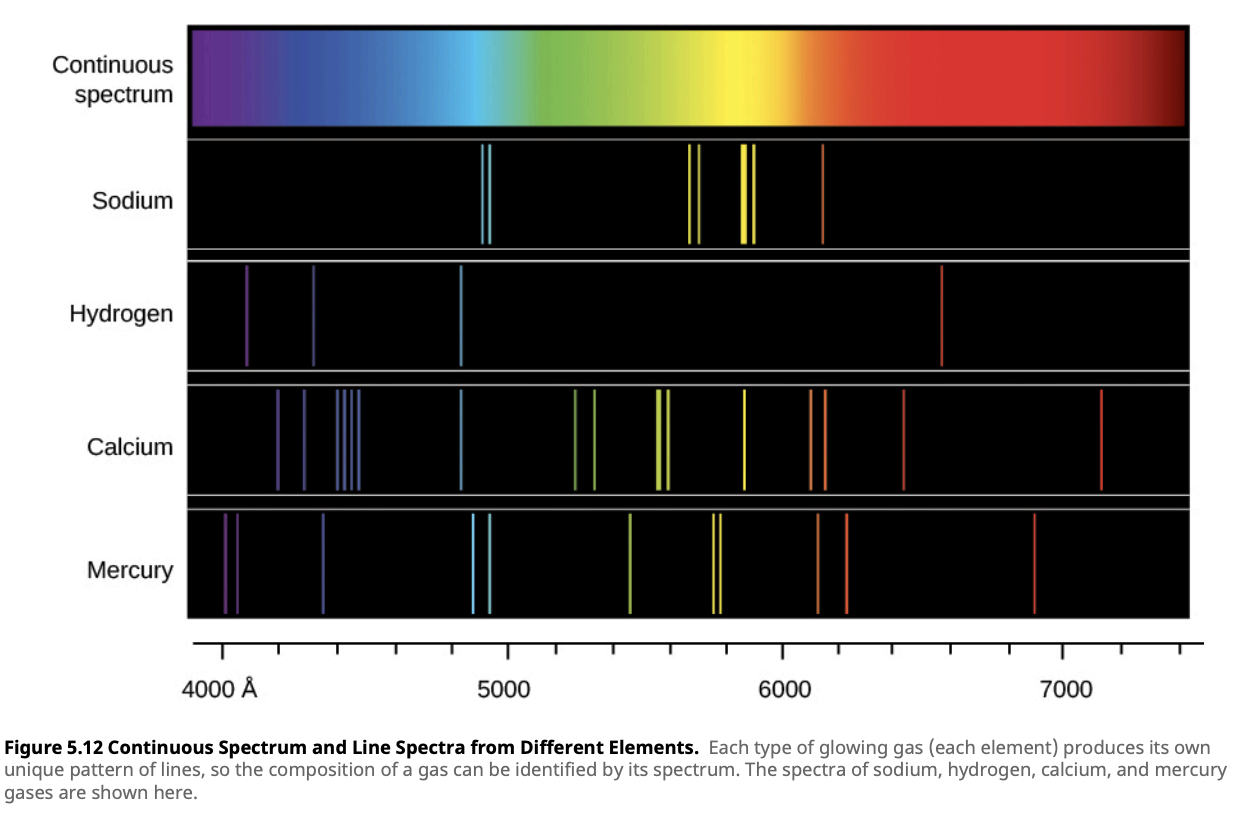
What is an Angstrom?
In the image above, the wavelengths on the horizontal axis are given in Angstroms (Å). An Angstrom (Å) is a unit of length commonly used to measure the wavelengths of light and other electromagnetic radiation. One angstrom is equal to \(1 \times 10^{-10}\) meters, or 0.1 nanometers. The angstrom is particularly useful in spectroscopy because many spectral lines, such as those of hydrogen, fall within the range of hundreds to thousands of angstroms. For example, the famous H-alpha line in the hydrogen spectrum has a wavelength of 6563 Å.Absorption Spectrum
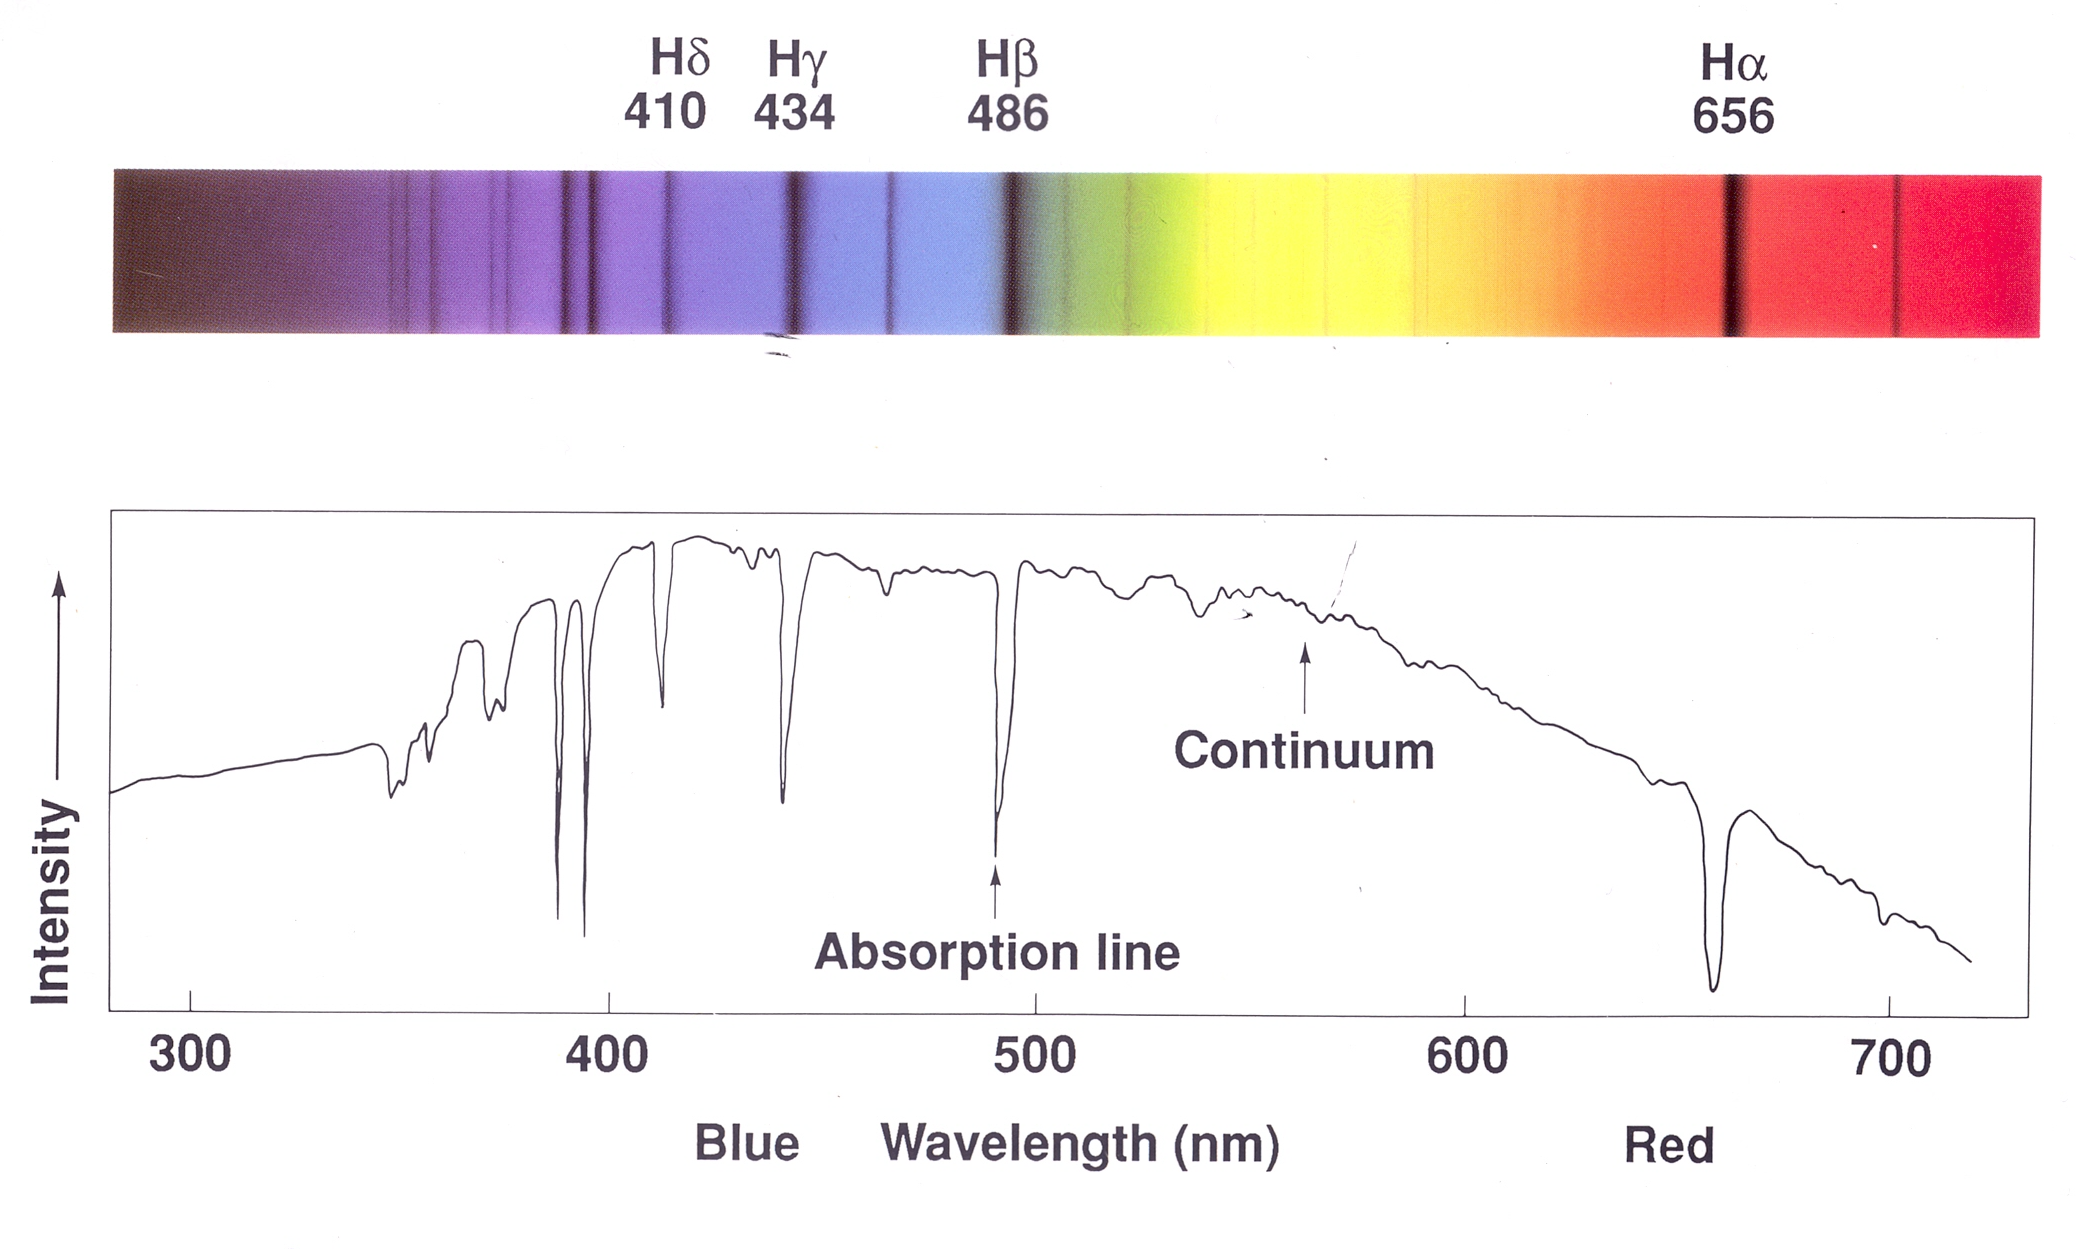
An absorption spectrum shows dark lines superimposed on a continuous spectrum. This happens when light from a hot, dense object (like the core of a star) passes through a cooler, less dense gas. The cooler gas absorbs light at specific wavelengths, leaving dark lines in the spectrum.
In Lesson 4.3, we learned that electrons in atoms can absorb photons, causing them to jump to higher energy levels. For an electron to move to a higher energy level, the energy of the absorbed photon must exactly match the energy difference between the two levels. This absorption removes light at a specific wavelength from the continuous spectrum, creating dark lines in the absorption spectrum.
We can relate the energy difference between the two levels to the wavelength of the absorbed light using the following equation:
\[\Delta E = h \cdot f = \frac{hc}{\lambda}\]
Where:
- $\Delta E$ is the energy difference between the two energy levels, in joules (J),
- $h$ is Planck’s constant, which is $6.626 \times 10^{-34} \, \text{J}\cdot\text{s}$, a fundamental constant that relates energy and frequency,
- $f$ is the frequency of the absorbed photon, in hertz (Hz),
- $c$ is the speed of light, which is $3.00 \times 10^8 \, \text{m/s}$,
- $\lambda$ is the wavelength of the absorbed photon, in meters (m).
Thus, by observing which wavelengths are missing from the spectrum, we can determine the energy levels involved in the electron transitions and identify the elements responsible for the absorption.
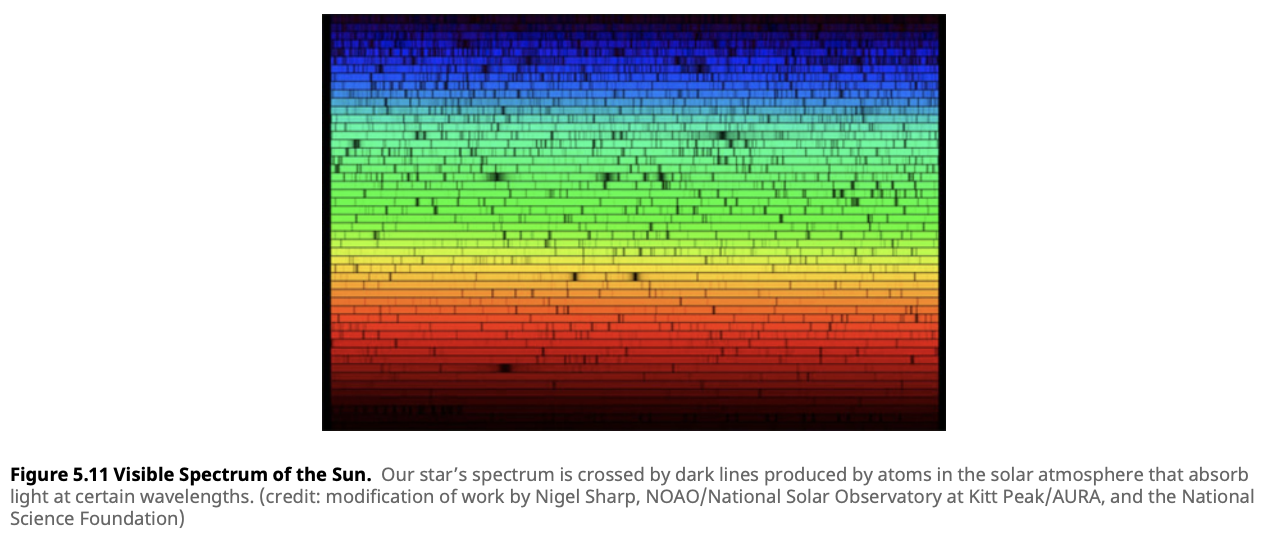
Absorption spectra are most commonly seen in stellar atmospheres. As light from the star’s core passes through the cooler outer layers, atoms in the atmosphere absorb light at certain wavelengths, creating absorption lines. These lines reveal the star’s chemical composition.
One famous example is the Fraunhofer lines in the Sun’s spectrum, where dark lines indicate elements like hydrogen and calcium absorbing light at specific wavelengths.
Modern astronomy represents absorption spectra as graphs of wavelength vs. intensity. In an absorption spectrum, most wavelengths of light maintain high intensity, but sharp dips occur at specific wavelengths where atoms absorb light. These dips correspond to the dark lines seen in the absorption spectrum and indicate the wavelengths at which light has been absorbed by the cooler gas.
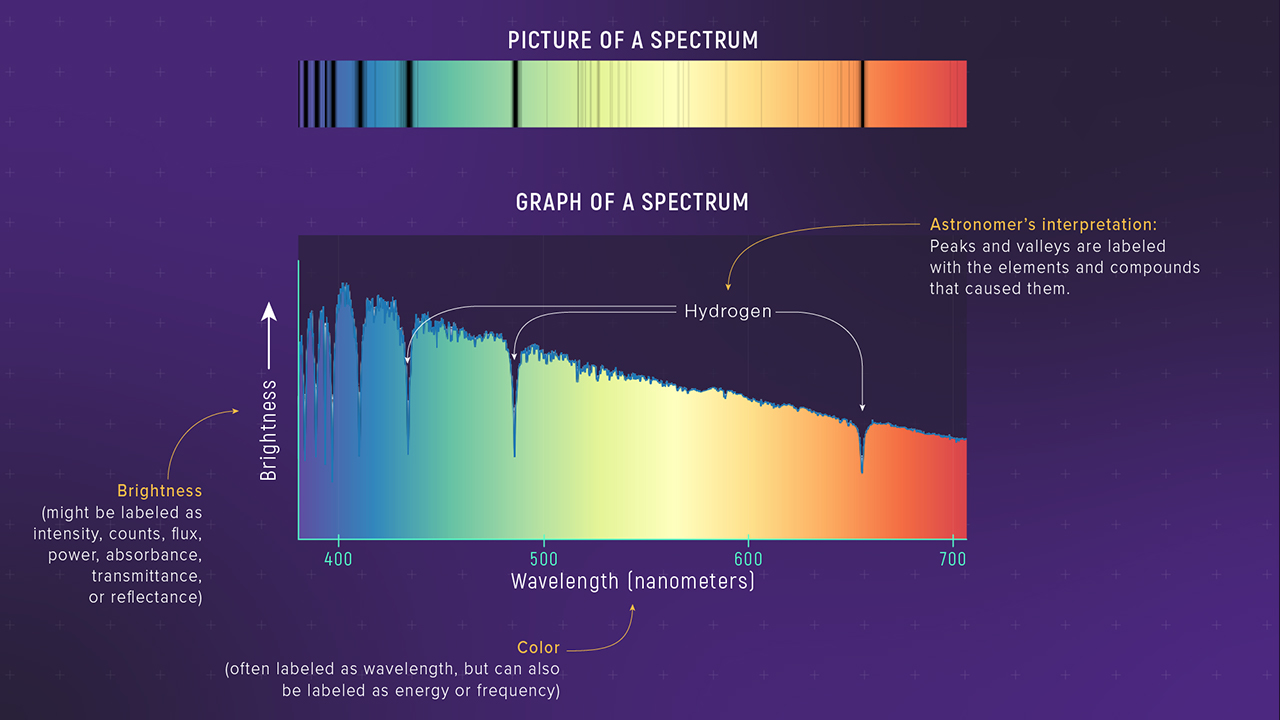
At these wavelengths, the intensity of the light decreases, forming distinct absorption lines. The positions of these lines allow astronomers to identify the elements present in the intervening gas, as each element absorbs light at specific wavelengths, leaving its “fingerprint” in the form of these absorption features.
Kirchhoff’s Laws of Spectroscopy
In 1859, Gustav Kirchhoff summarized the observations of the different types of spectra into three laws that describe how spectra are produced under different physical conditions. These laws form the foundation of modern spectroscopy in astronomy.
Kirchhoff’s First Law:
A hot, dense object (like a blackbody) emits a continuous spectrum. This law explains the emission from stars and other dense objects that radiate across a broad range of wavelengths without any gaps.
Kirchhoff’s Second Law:
A hot, low-density gas emits an emission-line spectrum. This occurs because the gas’s atoms emit light at specific wavelengths as electrons transition between discrete energy levels.
Kirchhoff’s Third Law:
When light from a hot, dense object passes through a cooler gas, an absorption-line spectrum is produced. The cooler gas absorbs light at specific wavelengths, corresponding to the energy needed for electrons to jump to higher levels.
These laws help astronomers determine the conditions under which light is produced and modified as it travels through space. By applying these laws, astronomers can infer the temperature, chemical composition, and density of stars and interstellar clouds.
Spectral Line Formation in Stellar Atmospheres
In stars, the light we observe is affected by the outer layers of the star’s atmosphere. The core of the star emits a continuous spectrum, but this light passes through the cooler gases of the star’s outer atmosphere. As the light travels through these gases, atoms in the gas absorb specific wavelengths, causing absorption lines to appear in the spectrum.
In Lesson 4.3, we saw that each element has a unique set of energy levels, meaning that each element will absorb light at distinct wavelengths. By analyzing the absorption lines in a star’s spectrum, astronomers can determine the star’s chemical composition, surface temperature, and other physical characteristics.
Line Broadening and Astrophysical Implications
Spectral lines are not infinitely narrow. Several physical processes cause spectral lines to broaden, providing further insights into the conditions within stars, galaxies, and other astronomical objects.
Doppler Broadening
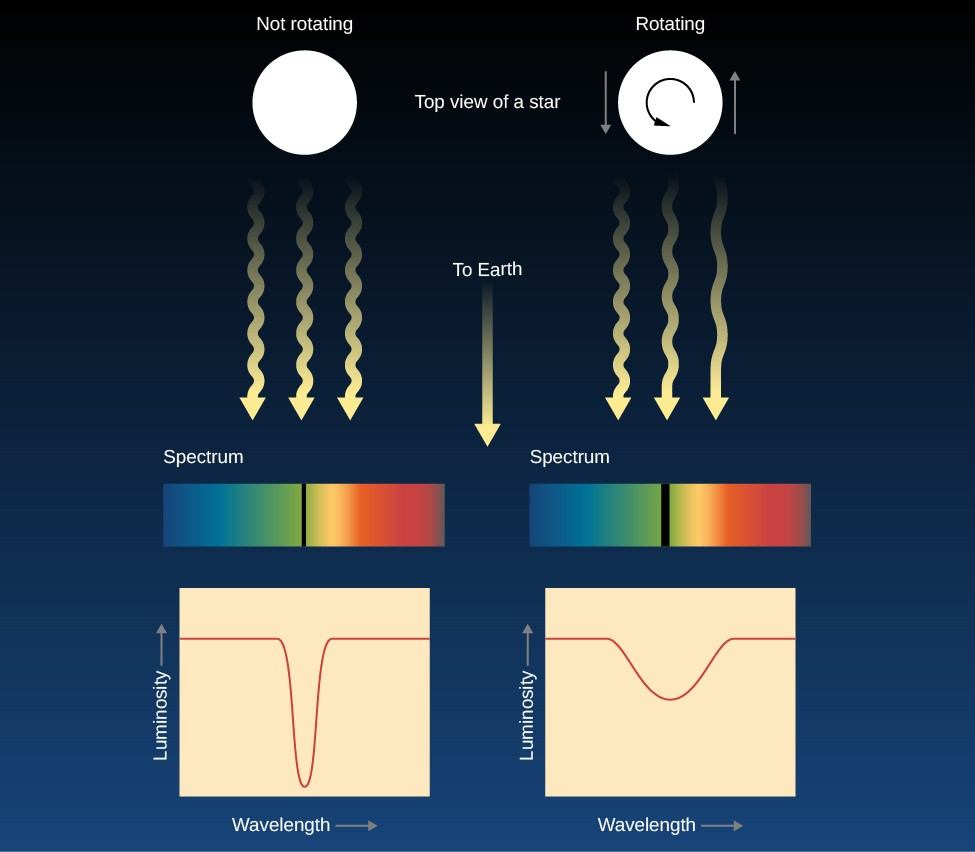
The Doppler effect broadens spectral lines when atoms are moving toward or away from the observer. If the gas is in motion, atoms moving toward the observer cause the wavelength to shorten (blueshift), while atoms moving away cause the wavelength to lengthen (redshift). The faster the gas is moving, the broader the spectral lines.
Pressure Broadening
Pressure broadening occurs in high-pressure environments, where collisions between atoms affect the energy levels of the electrons. In stars, the higher the pressure (usually in dense regions like the star’s core), the broader the spectral lines.
Check Your Understanding
-
Types of Spectra: What key difference between the conditions of the gas in an emission nebula and the gas in a star’s atmosphere leads to the formation of emission lines in one and absorption lines in the other?
-
Wavelength of Absorption: An electron absorbs a photon with an energy difference of $1.94 \times 10^{-18}$ J to jump from the $n = 1$ to the $n = 3$ energy level in a hydrogen atom. Calculate the wavelength of the absorbed photon. Use Planck’s constant $h = 6.626 \times 10^{-34} \, \text{J}\cdot \text{s}$ and the speed of light $c = 3.00 \times 10^8 \, \text{m/s}$.
-
Color and Temperature: A star is observed to emit its peak radiation at a wavelength of 450 nm. Using Wien’s Displacement Law, calculate the surface temperature of the star. ($b = 2.898 \times 10^{-3} \, \text{m}\cdot\text{K}$).
-
Absorption vs. Emission Spectra: Why do stars usually produce absorption spectra while nebulae produce emission lines?
-
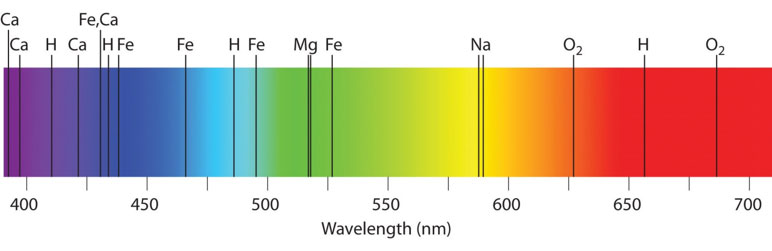
Identifying Elements: A star’s absorption spectrum shows dark lines at wavelengths of 589 nm, 656 nm, and 486 nm. Using the table below, identify which elements are present in the star’s atmosphere and explain how the spectral lines act as “fingerprints.”
| Wavelength (nm) | Element |
|---|---|
| 486 | Hydrogen (H) |
| 517 | Magnesium (Mg) |
| 589 | Sodium (Na) |
| 656 | Hydrogen (H) |
| 670 | Lithium (Li) |
| 706 | Helium (He) |
Resources
- Astronomy (2016). Andrew Fraknoi, David Morrison, and Sidney C. Wolff.
- The Atomic Spectrum