The color and intensity of a star’s light aren’t just beautiful to behold—they are cosmic clues, revealing the star’s temperature, energy output, and even its life cycle. This fascinating story of light is explained by blackbody radiation—a key concept in astrophysics that helps us decode the mysteries of the universe.
Blackbody radiation allows astronomers to measure the temperature of distant stars, understand their energy distribution, and classify them. In this lesson, we will uncover the secrets of this phenomenon and explore how the light from stars guides us to a deeper understanding of the cosmos.
Video
Watch this video for an explanation of blackbody radiation and Wien's Law.
The Blackbody Spectrum
At the heart of blackbody radiation is the concept of a blackbody—an idealized object that perfectly absorbs all the radiation that falls on it and re-emits it based purely on its temperature. This re-emitted radiation forms a characteristic curve known as the blackbody spectrum.
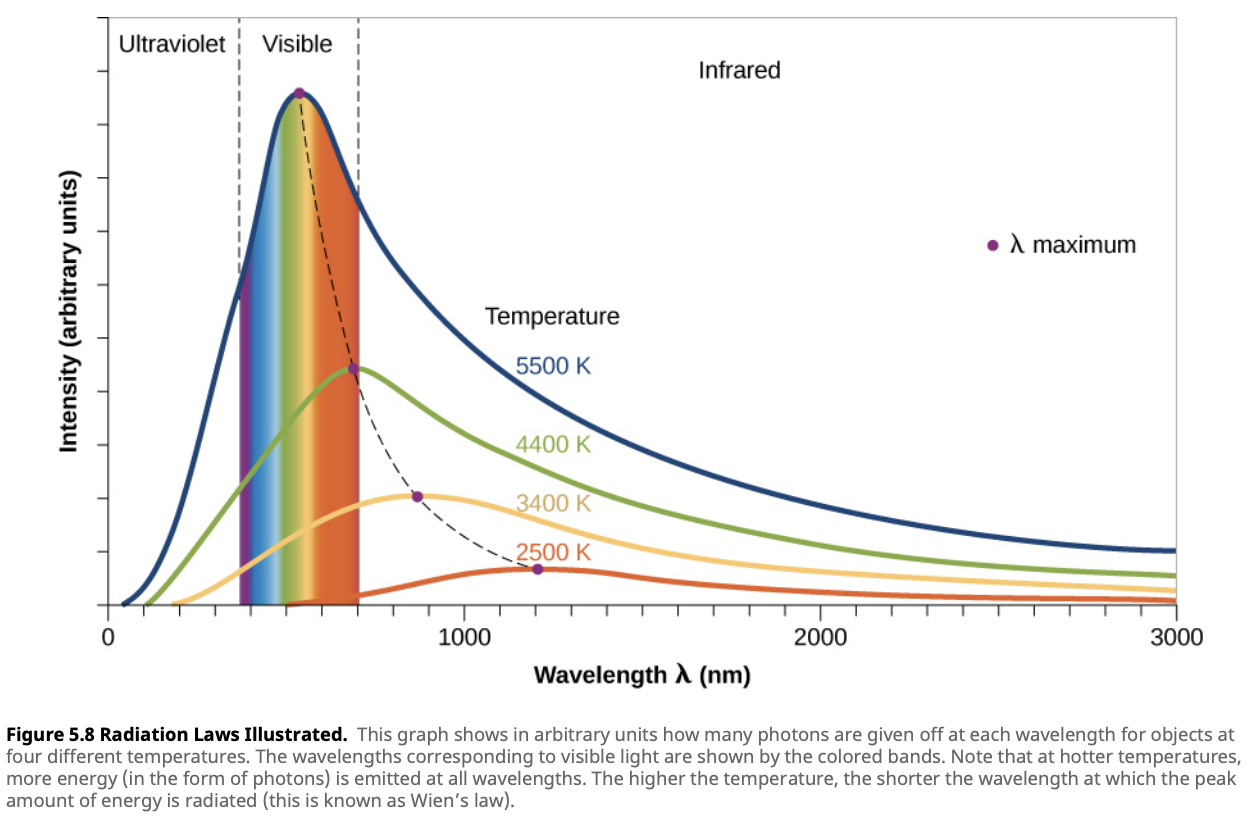
The blackbody spectrum is a graph that shows how the intensity of radiation emitted by an object varies across different wavelengths. There are several key features of this graph that provide valuable insights into the nature of the object emitting the radiation:
-
Wavelength (x-axis): The horizontal axis represents the wavelength of the emitted radiation, typically measured in nanometers (nm) or micrometers (µm). As you move from left to right on the graph, the wavelength increases. Shorter wavelengths correspond to higher energy radiation, such as ultraviolet and visible light, while longer wavelengths correspond to lower energy radiation, such as infrared.
-
Intensity (y-axis): The vertical axis represents the intensity or amount of radiation emitted at each wavelength. The height of the curve at a particular wavelength shows how much energy is being radiated at that wavelength. The higher the peak, the more radiation is emitted at that wavelength.
-
The Peak of the Curve: The peak of the blackbody spectrum indicates the wavelength at which the object emits the most radiation. Hotter objects have their peaks at shorter wavelengths (bluer light), while cooler objects have their peaks at longer wavelengths (redder light). This relationship is governed by Wien’s Displacement Law, which links temperature to the peak wavelength.
-
The Shape of the Curve: The shape of the blackbody curve rises steeply on the shorter wavelength side (left) and falls off more gradually on the longer wavelength side (right). This shape tells us how energy is distributed across different wavelengths, with hotter objects concentrating more energy in shorter wavelengths.
-
Area Under the Curve: The total area under the blackbody curve represents the total energy emitted by the object across all wavelengths. This area is directly related to the object’s temperature and is described by the Stefan-Boltzmann Law. Hotter objects emit more total energy, which results in a larger area under the curve. This explains why hotter stars are more luminous than cooler ones.
Interactive Exploration: Curious to see how temperature changes affect the blackbody spectrum? Use the simulator below to experiment with different temperatures and observe how the peak wavelength, total intensity, and area under the curve change. This hands-on experience will help you understand why hot objects glow blue while cooler ones appear red.
Wien’s Displacement Law
Have you ever noticed how some stars twinkle red in the night sky, while others gleam blue or white? This dazzling array of colors isn’t just for show—it’s a direct result of Wien’s Displacement Law, a powerful tool that helps astronomers determine the temperature of stars based on the color of their light.
Wien’s Displacement Law describes the relationship between the temperature of a blackbody and the wavelength at which it emits the most radiation. Essentially, it tells us that hotter objects radiate more at shorter wavelengths (toward the blue end of the spectrum), while cooler objects radiate more at longer wavelengths (toward the red end of the spectrum). Mathematically, this relationship is expressed as:
\[\lambda_{\text{max}} = \frac{b}{T}\]
where:
- $\lambda_{\text{max}}$ is the wavelength of maximum emission,
- $T$ is the temperature in Kelvin,
- $b$ is Wien’s constant, approximately $2.898 \times 10^{-3} \, \text{m/K}$.
What does this mean for stars?
- Cooler stars, like red dwarfs, have their peak emission in the red part of the spectrum, which is why they glow with a reddish hue.
- Hotter stars, like blue giants, emit more light at shorter wavelengths, making them appear blue or white.
Wien’s Displacement Law provides a cosmic thermometer, letting us gauge the temperature of stars billions of kilometers away simply by observing their light.
Example
If a star has a surface temperature of 5800 K (similar to the Sun), the peak wavelength of its radiation can be calculated as:
\[\lambda_{\text{max}} = \frac{2.898 \times 10^{-3} \, \text{m/K}}{5800 \, \text{K}} \approx 500 \, \text{nm}\]This wavelength is in the visible light range, explaining why the Sun appears white or yellowish to our eyes.
Stellar Age and Color
The color of a star can also tell us about its stage in the stellar life cycle. Hot, young stars tend to be blue or white, while older, cooler stars often appear red as they near the end of their life cycle. However, this relationship between color and age is complex and also depends on the star’s mass.Stefan-Boltzmann Law
Have you ever wondered why some stars shine brighter than others, even though they might be cooler? The secret lies in the Stefan-Boltzmann Law, a powerful relationship between the temperature of a star and the total energy it radiates.
The Stefan-Boltzmann Law tells us that the energy radiated per unit surface area by a blackbody increases dramatically with temperature—specifically, with the fourth power of the temperature! This means that even a small increase in a star’s temperature results in a massive increase in the energy it emits. The law is expressed mathematically as:
\[F = \sigma T^4\]
where:
- $F$ is the energy radiated per unit area,
- $T$ is the temperature in Kelvin,
- $\sigma$ is the Stefan-Boltzmann constant, approximately $5.67 \times 10^{-8} \, \text{W/m}^2 \cdot \text{K}^4$.
What does this mean for stars? Consider this: if one star is twice as hot as another, it doesn’t just emit twice the energy—it emits 16 times more energy per unit area! This is because the energy output scales with $T^4$, meaning that small differences in temperature can lead to enormous differences in brightness.
But temperature isn’t the only factor at play. The luminosity of a star, which is the total energy it emits, also depends on the star’s surface area. Large stars like red giants, even though they might be cooler, can shine just as brightly as smaller, hotter stars because they have much more surface area over which to radiate their energy.
Calculating the Power of a Star
While energy flux tells us how much power a star emits per square meter, we would often like to know how much total power is emitted by the star. We can determine that by multiplying the energy flux by the number of square meters on the surface of the star. Since stars are mostly spherical, we can use the formula $4\pi R^2$ for the surface area, where $R$ is the radius of the star.
The total power emitted by the star (which we call the star’s “absolute luminosity”) can be found by multiplying the formula for energy flux by the formula for the surface area:
\[L = 4\pi R^2 \sigma T^4\]
Example
Two stars have the same size and are the same distance from us. Star A has a surface temperature of 6000 K, and Star B has a surface temperature twice as high, 12,000 K. How much more luminous is Star B compared to Star A?
Start by writing the formula for the luminosity of each
star:
\(L_A = 4\pi R_A^2 \sigma T_A^4\)
\(L_B = 4\pi R_B^2 \sigma T_B^4\)Now, take the ratio of the luminosity of Star B to Star A: \(\frac{L_B}{L_A} = \frac{4\pi R_B^2 \sigma T_B^4}{4\pi R_A^2 \sigma T_A^4} = \frac{R_B^2 T_B^4}{R_A^2 T_A^4}\)
Since the two stars are the same size, we can simplify by setting $R_A = R_B$:
\[\frac{L_B}{L_A} = \frac{T_B^4}{T_A^4} = \left(\frac{12,000 \, \text{K}}{6,000 \, \text{K}}\right)^4 = 2^4 = 16\]So Star B is 16 times more luminous than Star A!
The Stefan-Boltzmann Law gives us a deeper understanding of how stars of different sizes and temperatures contribute to the dazzling array of brightness we see in the night sky.
Size, Temperature, and Luminosity
The Stefan-Boltzmann Law explains why a cool red giant can appear just as luminous as a small, blazing-hot blue star. Size and temperature both play crucial roles in determining a star’s brightness.Color Indices and Stellar Classification
When you look up at the night sky and see stars shining in different colors, you are witnessing more than just a beautiful display. Those colors are cosmic clues, revealing the temperature of the stars and providing a key to their classification. Astronomers use these colors, expressed as color indices, to categorize stars and unlock insights into their properties and evolution.
The color index is a numerical value that compares a star’s brightness at different wavelengths of light. To do this, astronomers use filters that allow specific wavelengths to pass through, measuring the star’s brightness in those wavelengths. One commonly used set of filters measures stellar brightness in three key regions of the spectrum:
- Ultraviolet (U) at 360 nm,
- Blue (B) at 420 nm,
- Visual (V) at 540 nm, which corresponds to yellow light.
The difference in brightness between two of these filters is called a color index. The most commonly used index in astronomy is the B–V index, which is calculated by subtracting the star’s visual magnitude (V) from its blue magnitude (B). This index is directly related to the star’s temperature:
- Hot stars (like O-type stars) emit more light in the blue part of the spectrum, resulting in a negative B–V index and giving them a blue appearance.
- Cool stars (like M-type stars) emit more light in the red part of the spectrum, resulting in a positive B–V index and giving them a red appearance.
Remember the Hertzsprung-Russell (HR) diagram you studied earlier? It plots stars based on their luminosity and temperature, and the color index helps pinpoint where a star belongs on this diagram. The spectral classification system (O, B, A, F, G, K, M) is based on the star’s temperature, which correlates with its color:
- O-type stars: The hottest and most massive, glowing blue with surface temperatures exceeding 25,000 K. These stars sit at the upper left of the HR diagram, where high-temperature, high-luminosity stars are found (remember the temperature on the HR diagram is typically inverted).
- M-type stars: The coolest and smallest, glowing red with temperatures around 3000 K. These stars are located at the lower right of the HR diagram, representing low-temperature, low-luminosity stars.
Color Indices
Vega, a bright star in the summer sky, has a B–V index close to 0, indicating it is a hot, blue-white star with a surface temperature around 10,000 K. In contrast, Betelgeuse, a cool red giant, has a B–V index around +2, reflecting its much lower surface temperature of about 3000 K.The color index is not just a tool for measuring temperature—it’s a vital part of understanding stellar evolution. By knowing a star’s color and classification, astronomers can determine its life cycle stage, from the fusion-powered main sequence to its final phases as a white dwarf, neutron star, or black hole.
Check Your Understanding
- Why does the peak wavelength of radiation emitted by a star shift towards shorter wavelengths as the star’s temperature increases?
- How can two stars of the same temperature have different luminosities?
- A star has a surface temperature of $3000 \, \text{K}$. Calculate its peak emission wavelength using Wien’s Displacement Law.
- If the emitted radiation from a red dwarf star has a wavelength of maximum power at 1200 nm, what is the temperature of this star, assuming it is a blackbody?
- What is the temperature of a star whose maximum light is emitted at a wavelength of 290 nm?
- If a star emits $1.42 \times 10^6 \, \text{W/m}^2$ of energy, what is its surface temperature?
- Two stars with identical diameters are the same distance away. One has a temperature of 8700 K and the other has a temperature of 2900 K. Which is brighter? How much brighter is it?
- If the emitted infrared radiation from Pluto has a wavelength of maximum intensity at 75,000 nm, what is the temperature of Pluto assuming it follows Wien’s law?
- Two stars have the same luminosity, but Star A has a temperature of 4000 K, while Star B has a temperature of 8000 K. Based on their temperatures, calculate the ratio of the radius of Star A to the radius of Star B (i.e. find $\frac{R_A}{R_B}$).
Resources
- Astronomy (2016). Andrew Fraknoi, David Morrison, and Sidney C. Wolff.